Public Tender Traffic Data Across 3 Provinces
- PataBid

- Jul 2, 2022
- 3 min read
Updated: Jul 15, 2022
During a momentary break from programming, I decided to see if I could ask the PataBid database an interesting question. How many tenders are open at any one time? Then it got me thinking, what could this look like?
After a couple of days of working intermittently with the database to answer this question, here are the results! Lets work West to East across three of the major power house provinces for the Canadian economy.

Starting in British Columbia (BC), the above graph gives the average monthly open tenders for each month since the PataBid system started collecting tenders out of BC. The data set starts in about March 2018. As it stands right now, it would appear that there has been a moderate increase in the amount of open tenders this year (the orange) over last year (the blue).
The trend for 2019 appears to be following that of 2018 quite closely so far this year as we head into the peak vacationing season. The amount of work to bid over the next few months will likely continue a minor downward trend, likely driven by work in progress and vacation season, then start to pick up again towards the years end in preparation for next year.

Moving into Alberta, unfortunately the news is not quite as good. The data set in this graph needs a bit of explaining, the significant spike in the data from 2018 around April - May represents a change in the programming for PataBid as we moved towards collecting all tenders and allowing the Artificial Intelligence (Doug) to work on a much larger data set.
Now that the explanation is out of the way, there is a very interesting trend showing up this year. This year started out with a solid increase in the quantity of open tenders from January and peaking in March. From this point on though there has been a significant slide in the number of open tenders continuing through June.
The trend is currently roughly following the same trend as 2018, however, about four months ahead of last year.
Unfortunately, based on a brief evaluation of the forward looking tenders (ex. Engineering tenders being posted/awarded), it looks like this trend may continue along with downward pressure on the values of these projects (i.e. potentially few and smaller value tenders being put out).

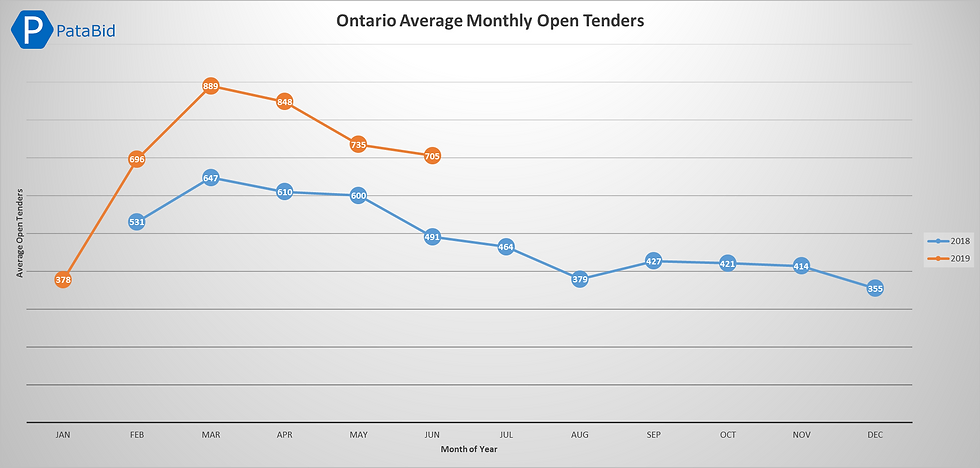
Jumping into Ontario, the trend here indicates a significant amount of tendering activity happening in Ontario this year over last year, specifically around the many medium sized municipalities. The data set for Ontario going back to roughly February of 2018.
The trending in general shows an interesting climb/peak in the early part of the year around March followed by a slow decline in open tenders to towards the end of the year. Compared to the western provinces it appears to generally be a more even trend.
This year has seen a fairly significant climb in the amount of open tenders per month over last year with a significant peak in March. The trend so far appears likely to follow that of last year at this point.
That being said, looking at the forward looking tenders, it would appear that there are several significant projects upcoming in Ontario, especially around the Kitchener/Waterloo region and Toronto areas.
Well, this concludes a relatively simple review of some of the data that PataBid is able to collect and analyze.
This data analysis is based on data collected from BC Bids, APC, Bids & Tenders, various municipal tender sites. It covers all sectors that issue tenders (not just construction, though that is the most significant portion of it). The PataBid Tenders platform collects, analyzes and organizes hundreds of public tenders daily from over 250 repositories across Canada and the US. We are your source for bid opportunities.


Comments